September’s housing data shows a market shifting gears – fewer closings, more listings, and contracts holding strong. For inspectors, that balance means steady work as sellers stay motivated and buyers take advantage of increased inventory.
Sales and inventory
- Existing home sales totaled 357,000 in September, down –5.1% from August but +8.2% YoY
- Year-to-date sales are now down –0.2%
- Active listings reached 1.56 million homes (+21.9% YoY), marking the largest supply since 2020, according to HouseCanary
- Month’s supply climbed to 5.49, edging toward a buyer’s market
Contracts and pricing
- HouseCanary reports 283,409 homes went under contract, up +11.0% YoY
- Price cuts rose +21.6% YoY, remaining at their highest level since 2020
- The median closed price increased +3.5% YoY to $433,239
- The national median existing home price was $415,200, a +2.1% YoY gain
- Regionally, the Midwest (+4.7%) and Northeast (+4.1%) led, while the West (+0.4%) remained flat
Mortgage rates
- Mortgage rates averaged 6.6% in Q3
- Fannie Mae now projects rates to decline more gradually to 6.2% by early 2026 and 5.9% by the end of the year, while the Mortgage Bankers Association expects rates to stay near 6.5% through 2028
Current forecasts
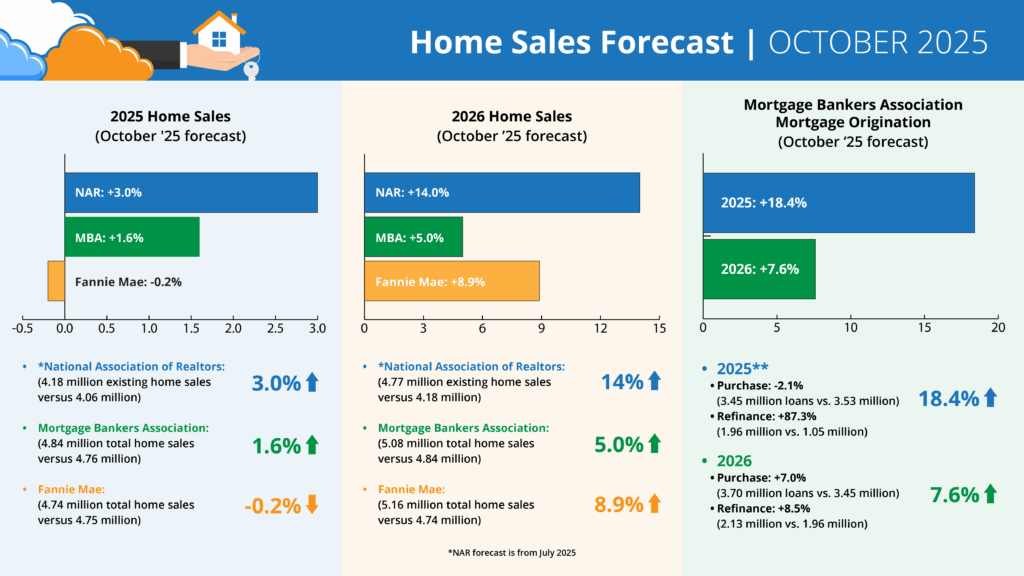
Forecasts for 2025 home sales (October ‘25 forecast)
- *NAR: +3.0% (4.18 million existing home sales vs. 4.06 million)
- MBA: +1.6% (4.84 million total home sales vs. 4.76 million)
- Fannie: -0.2% (4.74 million total home sales vs. 4.75 million)
Forecasts for 2026 Home Sales (October ’25 forecast)
- *NAR: +14.0% (4.77 million existing home sales vs. 4.18 million)
- MBA: +5.0% (5.08 million total home sales vs. 4.84 million)
- Fannie: +8.9% (5.16 million total home sales vs. 4.74 million)
MBA Forecast for Mortgage Originations (October ’25 forecast)
- 2025** Total Mortgage Originations: +18.4% (5.41 million loans vs. 4.57 million)
- Purchase: -2.1% (3.45 million loans vs. 3.53 million)
- Refi: +87.3% (1.96 million vs. 1.05 million)
- 2026 Total Mortgage Originations: +7.6% (5.82 million loans vs. 5.41 million)
- Purchase: +7.0% (3.70 million loans vs. 3.45 million)
- Refi: +8.5% (2.13 million vs. 1.96 million)
* NAR forecast is from July 2025
What it means for inspectors
For HIP inspectors, the story is clear: more listings and strong contract activity could contribute to keeping inspections steady, even as overall sales dip. Motivated sellers and flexible buyers may mean more inspections on tighter timelines – and more opportunities to stand out with professional, customizable reports.
As forecasts point to a 2026 recovery, the groundwork you lay now – refining templates, strengthening relationships, and streamlining operations – could pay off when transaction volume rises again.