Market conditions tighten heading into winter
October’s data shows a housing market defined by constrained supply and steady demand. 358,000 existing home sales closed in October (+0.8% MoM, +2.9% YoY). Year-to-date sales remain +0.1% over 2024.
New supply continues to decline – 219,618 net new listings (-9.5% YoY) – while demand remains firm with 272,257 homes under contract (+10.4% YoY). With fewer listings replenishing what sells, competition remains a factor.
Pricing concentration at the high end
Price resilience persists, particularly in upper-tier homes, with the $600K+ and $1M+ ranges seeing the most activity. The under $200K market continues to shrink. Median listing prices stay flat, while closing prices trend upward – a sign inventory remains tight enough to hold pricing power.
The national median existing home price is $415,200, rising +2.1% YoY.
- Midwest: +4.6%
- Northeast: +6.5%
- South and West: nearly flat (<+0.3%)
Mortgage rates and longer-term projections
Mortgage rates averaged 6.6% in Q3.
- Fannie Mae projects rates falling to 6.2% by early 2026 and 5.9% by late 2026
- MBA expects the 30-year fixed to remain between 6.4% and 6.35% through 2028
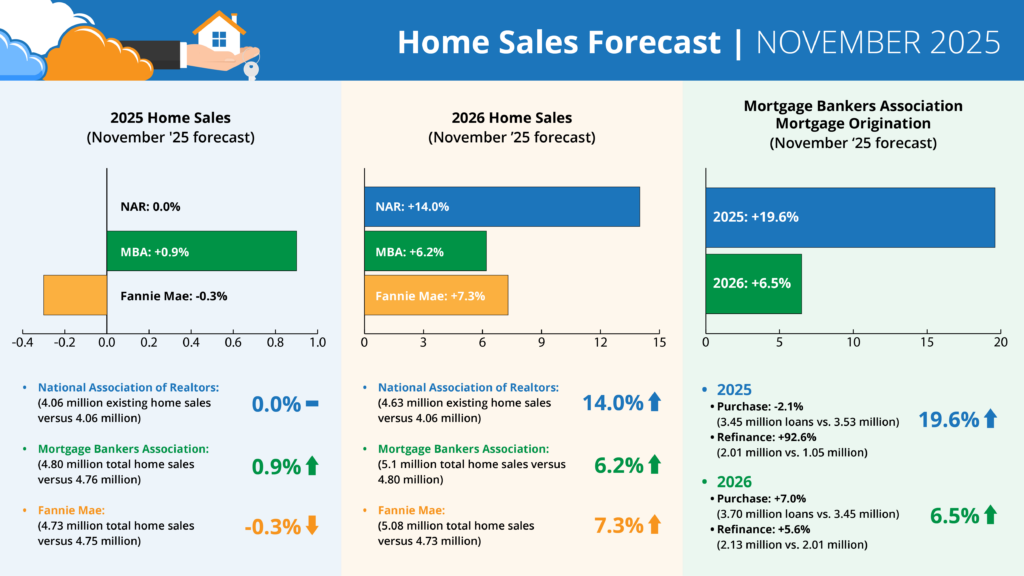
Forecasts for 2025 home sales (November ‘25 forecast)
- NAR: 0.0% (4.06 million existing home sales vs. 4.06 million)
- MBA: +0.9% (4.80 million total home sales vs. 4.76 million)
- Fannie: -0.3% (4.73 million total home sales vs. 4.75 million)
Forecasts for 2026 home sales (November ‘25 forecast)
- NAR: +14.0% (4.63 million existing home sales vs. 4.06 million)
- MBA: +6.2% (5.1 million total home sales vs. 4.8 million)
- Fannie: +7.3% (5.08 million total home sales vs. 4.73 million)
MBA forecast for mortgage originations (November ‘25 forecast)
2025 total mortgage originations: +19.6% (5.47 million loans vs. 4.57 million)
- Purchase: -2.1% (3.45 million loans vs. 3.53 million)
- Refi: +92.6% (2.01 million vs. 1.05 million)
2026 total mortgage originations: +6.5% (5.82 million loans vs. 5.47 million)
- Purchase: +7.0% (3.70 million loans vs. 3.45 million)
- Refi: +5.6% (2.13 million vs. 2.01 million)
What it means for inspectors
With supply tightening and demand holding, inspection volume may remain consistent even heading into winter. In higher-priced markets – where negotiation stakes rise – detailed reporting and clearer documentation may offer even more value for clients and agents weighing confidence, concessions, and timing.
With stronger growth projected into 2026, inspectors who focus on report clarity, brand presentation, and communication may find opportunities to differentiate before volume increases.