The latest housing data shows a market that’s holding steady, but not without some tension. Sales were flat in June, pricing is climbing in some regions, and 2025 forecasts are being revised downward.
Still, inventory remains strong, and 2026 is looking more optimistic. If rates come down even slightly, a busier fall isn’t off the table, and that’s something inspectors should keep an eye on.
A look at June 2025 sales and inventory trends
- Existing home sales for June 2025 totaled 391,000 (non-seasonally adjusted), essentially flat from May (+0.3% MoM) and up +4.0% YoY; year-to-date existing home sales are down -1.5%
- Inventory held at 1.53 million homes, just below the May peak and up +15.9% YoY
- HouseCanary reports a +23.1% YoY increase in inventory and a +7.3% increase in contract volume; closed prices rose +2.8%, while price cuts increased +32.3%
- The national median existing home price increased to $435,300, a +2.0% YoY gain, with the Midwest (+3.4%) and Northeast (+4.2%) leading price growth
- Mortgage rates averaged 6.8% in June, with expectations for a slight decline to around 6.7% by year-end, according to the Mortgage Bankers Association (MBA)
Updated forecast from NAR
NAR released their second quarter forecast update this month:
- The outlook for existing home sales in 2025 was lowered to 3% YoY growth (from 6%)
- The 2026 existing home sales forecast increased to +14% YoY growth (from 11%)
- The 2025 existing home sales forecast average (including NAR, MBA and Fannie) is now +2.3% YoY growth, down from 6.8% at the beginning of the year
Current market outlook for 2025 and 2026
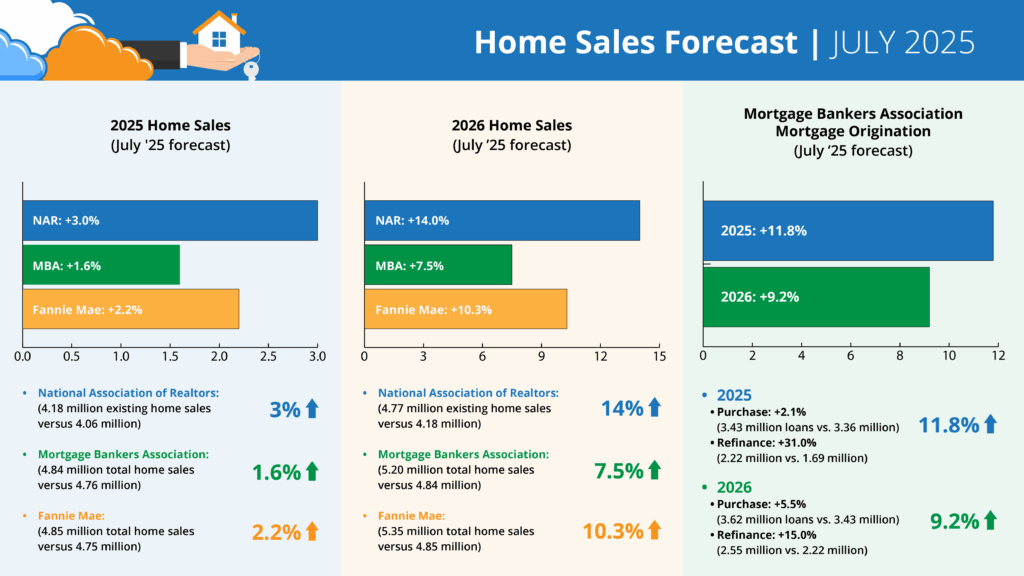
Forecasts for 2025 home sales (July ’25 forecast)
- NAR: +3.0% (4.18 million existing home sales vs. 4.06 million)
- MBA: +1.6% (4.84 million total home sales vs. 4.76 million)
- Fannie Mae: +2.2% (4.85 million total home sales vs. 4.75 million)
Forecasts for 2026 home sales (July ’25 forecast)
- NAR: +14.0% (4.77 million existing home sales vs. 4.18 million)
- MBA: +7.5% (5.20 million total home sales vs. 4.84 million)
- Fannie Mae: +10.3% (5.35 million total home sales vs. 4.85 million)
MBA forecast for mortgage originations (July ’25 forecast)
2025 total mortgage originations: +11.8% (5.65 million loans vs. 5.05 million)
- Purchase: +2.1% (3.43 million loans vs. 3.36 million)
- Refinance: +31.0% (2.22 million vs. 1.69 million)
2026 total mortgage originations: +9.2% (6.17 million loans vs. 5.65 million)
- Purchase: +5.5% (3.62 million loans vs. 3.43 million)
- Refinance: +15.0% (2.55 million vs. 2.22 million)
What it means for HIP users
Inspectors using HIP already know how important it is to run a lean, efficient business – especially when the market’s in a holding pattern.
Now’s the time to prep for more fall bookings—get your templates dialed in, automate reminders and payments with HIP Office, and keep your reports quick and polished with HIP’s mobile tools.
If the pace picks up, you’ll be ready.