Are inspection timelines starting to tighten as the spring market picks up?
March data suggests they are.
Existing home sales totaled 327,000 in March, up +26.3% from February and +3.8% YoY, according to the National Association of Realtors (NAR). Activity is picking up as the spring season gets underway.
Inventory is also moving higher. Active listings reached 1.23 million homes, up +9.5% month over month and +4.2% YoY, according to Zillow. More homes are hitting the market, creating more opportunities for transactions.
At the same time, deals are moving faster again. Homes went pending in a median of 19 days, which is nine days quicker than February. Faster timelines mean inspection windows tighten, and turnaround expectations increase.
Prices remain stable. The national median came in at $408,800, up +1.4% YoY. The Northeast (+5.7%) and Midwest (+4.9%) led gains, the South (+0.8%) was nearly flat, and the West (-1.3%) declined.
Mortgage rates continue to hold in the low-to-mid 6% range. Fannie Mae expects 6.2% in 2026 and 6.1% in 2027, while the Mortgage Bankers Association (MBA) projects 6.1%-6.3%. Rates have fluctuated slightly in April but remain within that range.
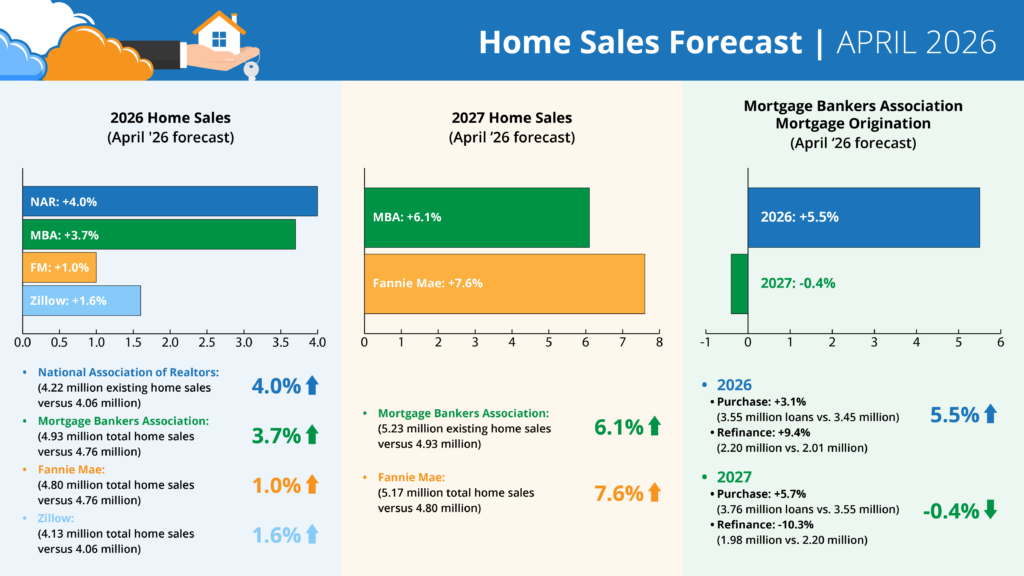
Current Forecasts
Forecasts for 2026 Home Sales (April ’26 forecast)
- NAR: +4.0% (4.22 million existing home sales vs. 4.06 million) – revised April 2026
- MBA: +3.7% (4.93 million total home sales vs. 4.76 million) – April ’26 forecast
- Fannie: +1% (4.80 million total home sales vs. 4.76 million) – April ’26 forecast
- Zillow: +1.6% (4.13 million existing home sales vs. 4.06 million) – April ’26 forecast
Forecasts for 2027 Home Sales (April ’26 forecast)
- MBA: +6.1% (5.23 million total home sales vs. 4.93 million) – April ’26 forecast
- Fannie: +7.6% (5.17 million total home sales vs. 4.80 million) – April ’26 forecast
MBA Forecast for Mortgage Originations (April ’26 forecast)
- 2026 Total Mortgage Originations: +5.5% (5.76 million loans vs. 5.46 million)
- Purchase: +3.1% (3.55 million loans vs. 3.45 million)
- Refi: +9.4% (2.20 million vs. 2.01 million)
- 2027 Total Mortgage Originations: -0.4% (5.73 million loans vs. 5.76 million)
- Purchase: +5.7% (3.76 million loans vs. 3.55 million)
- Refi: -10.3% (1.98 million vs. 2.2 million)
For inspectors, this is where speed starts to matter more. Faster deal timelines mean less room to delay inspections or reports. If activity continues to build, staying efficient and turning around clean, clear reports quickly will be key to keeping up.